Superior Methods
We combine academic research design, our own data-collection app and field experience across Indonesia to produce figures you can check, not just take on trust.
Academic research standards
Multistage random sampling, piloted instruments and weighting to population parameters.
Digital evidence for every interview
GPS, a hidden timer, photos and a digital signature recorded automatically.
Supervised by a doctor of statistics
Sampling and analysis are supervised directly, then interpreted by political scientists in the local context.
Every interview leaves a trail that can be checked
Our enumerators work with ASPIRASI’s own survey app. Field evidence is captured automatically, so data quality is protected from the very first question.
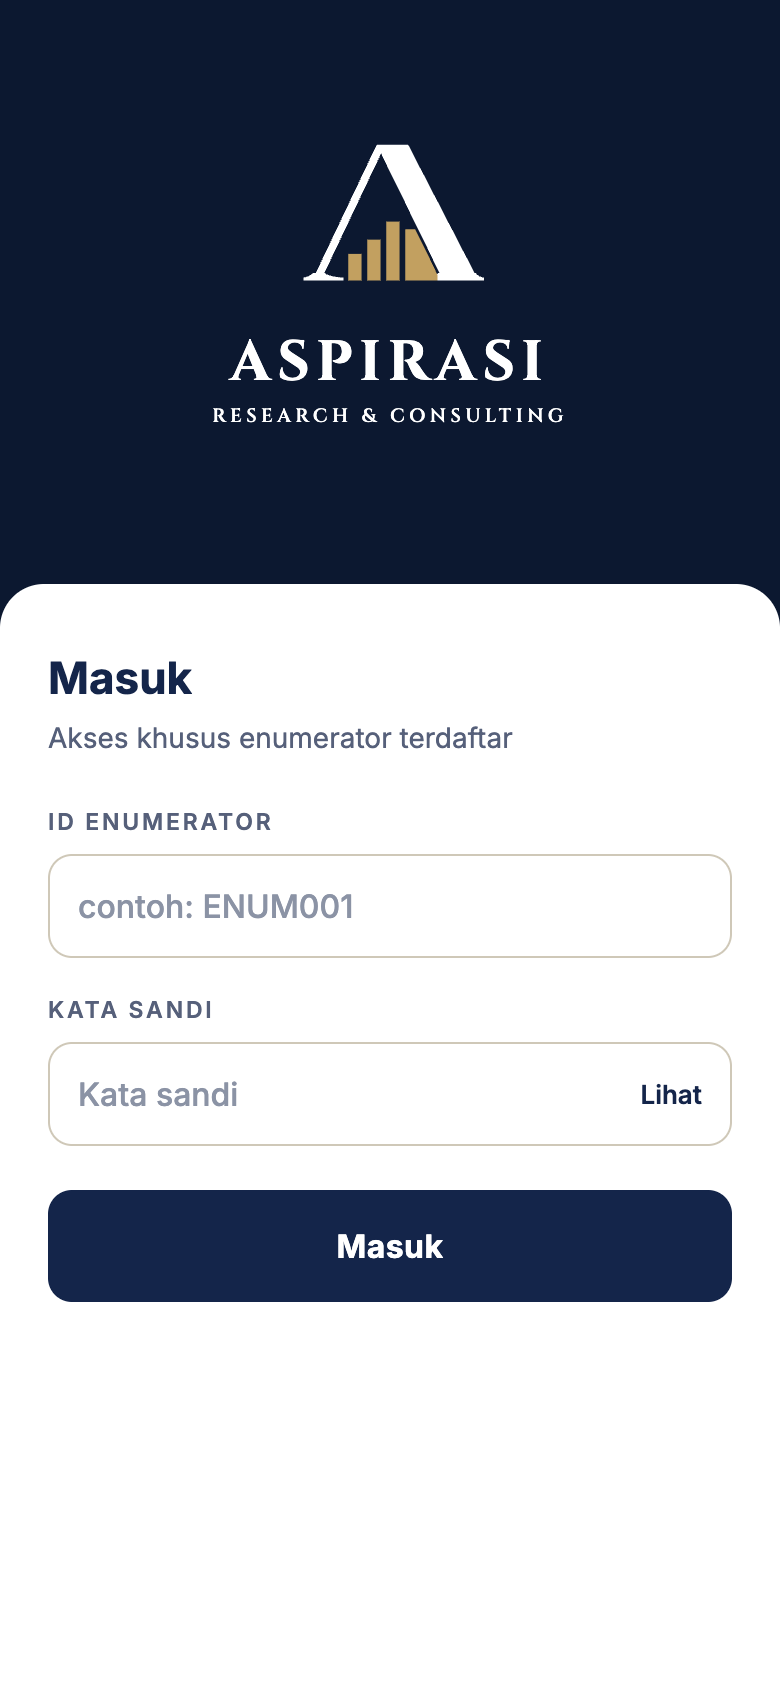
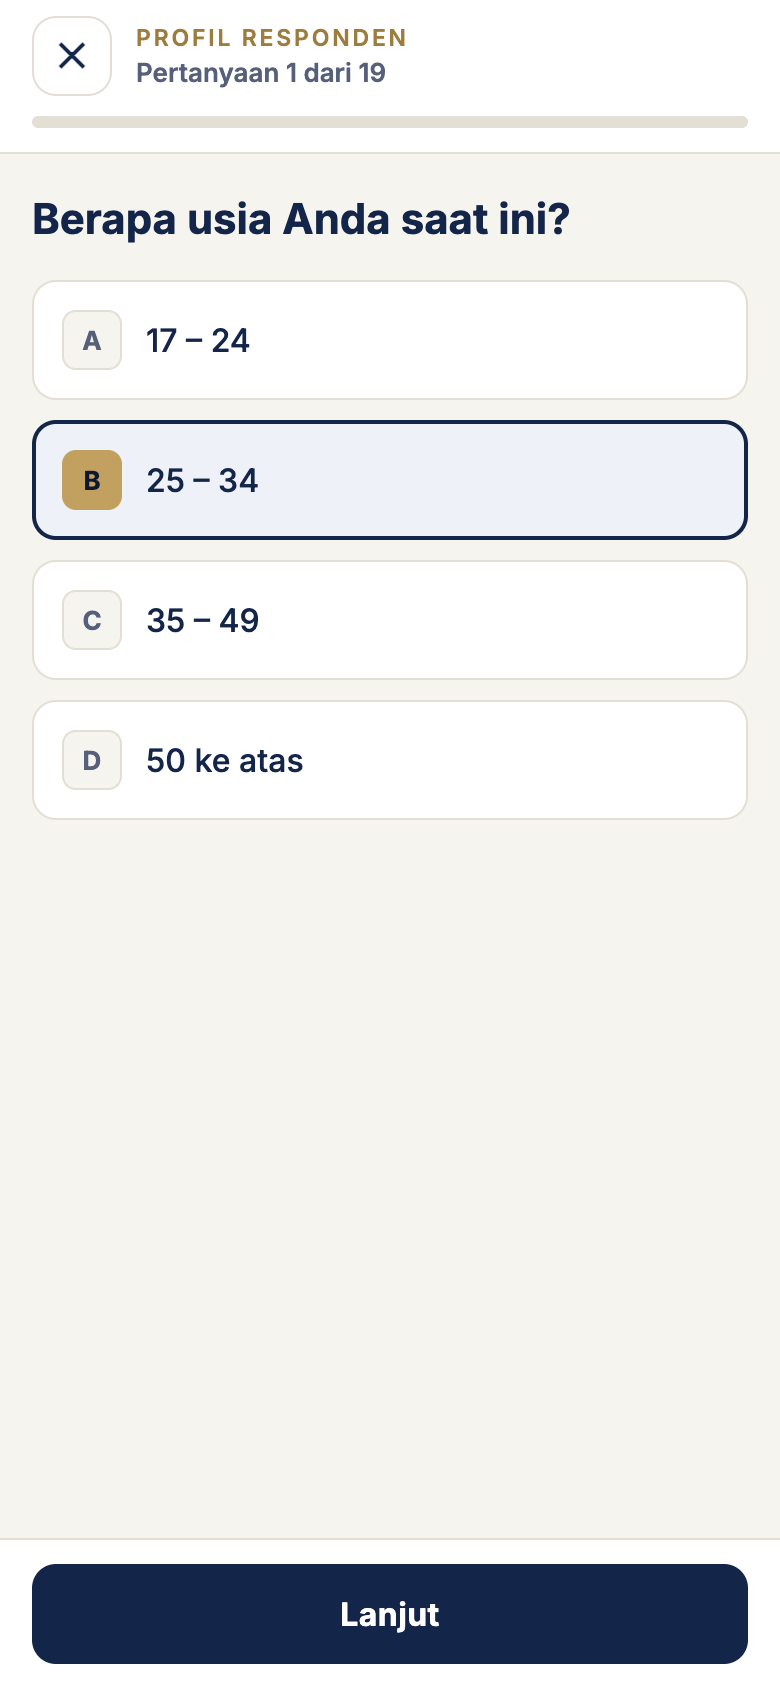
Screenshots of the ASPIRASI enumerator app. Feature cards are illustrations.
GPS location check
Coordinates and location accuracy are recorded automatically for every interview and matched against the assigned sampling point.
Hidden interview timer
The length of each interview and of each question is recorded in the background, out of the enumerator’s sight. Interviews that are too short are flagged automatically.
Respondent photo (with consent)
With the respondent’s consent, a photo is taken in the app as proof of the interview. It is used for internal verification only and never published.
Digital signature
Respondents sign on screen to give their informed consent before the interview begins.
Works without signal
The questionnaire runs fully offline. Data is stored on the device and syncs automatically once a signal is available, so remote areas stay within reach.
Anti-fraud checks
The system flags suspicious patterns: implausible durations, repeated locations, uniform answers, or interviews logged back-to-back.
Electoral dashboard (real-time)
Our central team and our clients follow sample progress, field locations and interim results in real time from one dashboard.
Four survey modes
Each method has its own strengths. We recommend the combination that best fits your population, budget and deadline. The same methods power our public-trust index: how much a figure or institution is trusted, and why.
- Core standard
Face-to-face CAPI
Trained enumerators interview respondents in person at home, using the app on a phone. It reaches every segment of society, including people without internet or phone access.
- High control
Telephone CATI
Trained interviewers call respondents directly. Interview quality control is high, misunderstandings are kept to a minimum and answers can be clarified on the spot.
- Cost-saving
Self-administered Web
An interactive questionnaire link is sent by WhatsApp or SMS to numbers drawn by Random Digit Dialling (RDD). Respondents fill it in themselves: cost-efficient and private.
- High response
Hybrid Dual-mode
An initial phone contact verifies the respondent and confirms consent, followed by an instant link, or a follow-up phone interview if the link is not opened.
Comparing remote methods
| Indicator | Telephone (CATI) | Self-administered (web link) | RecommendedHybrid |
|---|---|---|---|
| Response rate | High (40–55%) | Medium (15–25%) | Very high (>60%) |
| Budget & cost efficiency | Moderate (operator workload) | Very efficient | Balanced (optimal) |
| Depth & quality control | Very good | Limited to self-report | High & verified |
| Data-collection speed | 1–2 weeks | 3–5 days | 1–2 weeks |
Face-to-face interviewing (CAPI) remains our first choice for national electoral and public-opinion surveys; the three remote methods above complement it.
An electoral map database for all of Indonesia
ASPIRASI holds a complete electoral map database for all of Indonesia.
- Election results down to regency and city level, and to districts where data exists, ready to compare across areas
- Used to design samples, read bases of support and shape constituency strategy
- Delivered to clients as interactive maps and dashboards, like the official 2024 presidential result below
2024 presidential election — national to regency level
Declared by KPU, 20 March 2024
- 01Anies–MuhaiminAnies Baswedan – Muhaimin Iskandar24.95%
- 02Prabowo–GibranWinnerPrabowo Subianto – Gibran Rakabuming Raka58.59%
- 03Ganjar–MahfudGanjar Pranowo – Mahfud MD16.47%
164,227,475 valid votes in total, including 671,366 cast by voters abroad.
- 01 Anies–Muhaimin
- 02 Prabowo–Gibran
- 03 Ganjar–Mahfud
Deeper shade = larger winning share
Results by province (38)
| Sumatra | 73.56%2,369,534 | 24.43%787,024 | 2.01%64,677 | 3,221,235 |
|---|---|---|---|---|
| Sumatra | 29.25%2,339,620 | 58.26%4,660,408 | 12.49%999,528 | 7,999,556 |
| Sumatra | 56.53%1,744,042 | 39.45%1,217,314 | 4.02%124,044 | 3,085,400 |
| Sumatra | 37.96%1,400,093 | 52.35%1,931,113 | 9.69%357,298 | 3,688,504 |
| Sumatra | 24.15%532,605 | 65.23%1,438,952 | 10.62%234,251 | 2,205,808 |
| Sumatra | 18.98%997,299 | 69.47%3,649,651 | 11.55%606,681 | 5,253,631 |
| Sumatra | 18.10%229,681 | 70.42%893,499 | 11.47%145,570 | 1,268,750 |
| Sumatra | 15.49%791,892 | 69.55%3,554,310 | 14.96%764,486 | 5,110,688 |
| Sumatra | 23.08%204,348 | 59.85%529,883 | 17.07%151,109 | 885,340 |
| Sumatra | 32.15%370,671 | 55.64%641,388 | 12.21%140,733 | 1,152,792 |
| Java | 41.07%2,653,762 | 41.67%2,692,011 | 17.26%1,115,138 | 6,460,911 |
| Java | 31.68%9,099,674 | 58.50%16,805,854 | 9.82%2,820,995 | 28,726,523 |
| Java | 12.58%2,866,373 | 53.08%12,096,454 | 34.35%7,827,335 | 22,790,162 |
| Java | 19.80%496,280 | 50.63%1,269,265 | 29.57%741,220 | 2,506,765 |
| Java | 17.52%4,492,652 | 65.19%16,716,603 | 17.29%4,434,805 | 25,644,060 |
| Java | 34.02%2,451,383 | 55.99%4,035,052 | 9.99%720,275 | 7,206,710 |
| Bali & Nusa Tenggara | 3.70%99,233 | 54.26%1,454,640 | 42.04%1,127,134 | 2,681,007 |
| Bali & Nusa Tenggara | 26.20%850,539 | 66.37%2,154,843 | 7.43%241,106 | 3,246,488 |
| Bali & Nusa Tenggara | 5.27%153,446 | 61.80%1,798,753 | 32.93%958,505 | 2,910,704 |
| Kalimantan | 22.34%718,641 | 61.05%1,964,183 | 16.61%534,450 | 3,217,274 |
| Kalimantan | 16.98%256,811 | 72.53%1,097,070 | 10.50%158,788 | 1,512,669 |
| Kalimantan | 35.16%849,948 | 58.23%1,407,684 | 6.62%159,950 | 2,417,582 |
| Kalimantan | 20.09%448,046 | 69.15%1,542,346 | 10.77%240,143 | 2,230,535 |
| Kalimantan | 17.67%72,065 | 69.71%284,209 | 12.62%51,451 | 407,725 |
| Sulawesi | 7.30%119,103 | 75.31%1,229,069 | 17.39%283,796 | 1,631,968 |
| Sulawesi | 21.50%386,743 | 69.57%1,251,313 | 8.93%160,594 | 1,798,650 |
| Sulawesi | 37.94%2,003,081 | 57.02%3,010,726 | 5.04%265,948 | 5,279,755 |
| Sulawesi | 23.09%361,585 | 71.11%1,113,344 | 5.79%90,727 | 1,565,656 |
| Sulawesi | 29.39%227,354 | 65.24%504,662 | 5.37%41,508 | 773,524 |
| Sulawesi | 27.23%223,153 | 65.14%533,757 | 7.63%62,514 | 819,424 |
| Maluku | 21.16%228,557 | 61.59%665,371 | 17.25%186,395 | 1,080,323 |
| Maluku | 26.85%200,459 | 60.93%454,943 | 12.23%91,293 | 746,695 |
| Papua | 10.81%67,592 | 60.62%378,908 | 28.56%178,534 | 625,034 |
| Papua | 11.32%37,459 | 52.26%172,965 | 36.43%120,565 | 330,989 |
| Papua | 13.31%41,906 | 51.74%162,852 | 34.95%110,003 | 314,761 |
| Papua | 11.66%128,577 | 57.94%638,616 | 30.40%335,089 | 1,102,282 |
| Papua | 21.89%284,184 | 64.56%838,382 | 13.55%175,956 | 1,298,522 |
| Papua | 13.53%48,405 | 58.54%209,403 | 27.93%99,899 | 357,707 |
| Overseas | 18.64%125,110 | 63.73%427,871 | 17.63%118,385 | 671,366 |
| National | 24.95%40,971,906 | 58.59%96,214,691 | 16.47%27,040,878 | 164,227,475 |
Layered quality control, from sample to report
Trust in a number comes from a process that can be checked. Every project passes six layers of checks before the results reach you.
Sample & questionnaire design
The sampling frame is built from official population data using multistage random sampling, supervised by a statistician with a doctorate; questionnaires are piloted before fieldwork.
Trained, registered enumerators
Enumerators are trained and tested before deployment. Each account is registered and tied to its assigned area.
Checks during the interview
GPS, a hidden timer, photos and a digital signature record evidence of every interview automatically.
Re-verification
A random share of respondents is called or visited again by a separate team (spot checks and back-checks).
Validation & data cleaning
Consistency tests and detection of duplicates and implausible answer patterns; records that fail verification are excluded from analysis.
Transparent analysis & reporting
Weighting to population parameters; the methodology, margin of error and confidence level are stated in every report, and findings are reported as they are.
We protect respondents’ confidentiality: personal data is used only for verification and is never published.